
Market Pulse
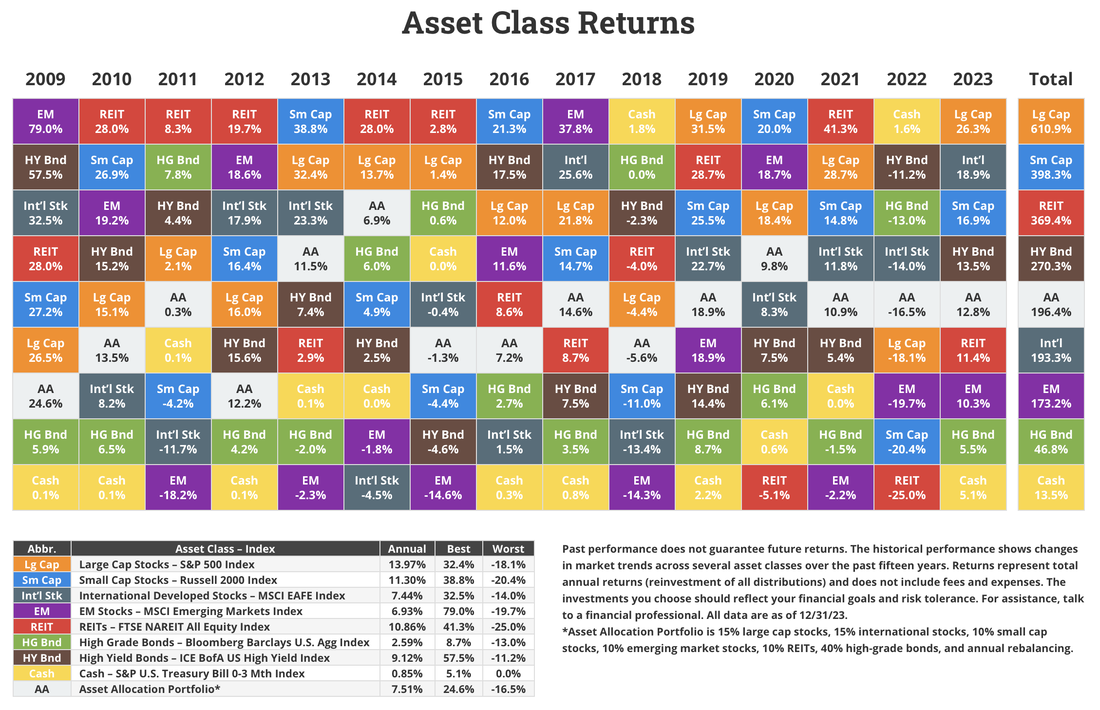
Graphic courtesy of Novel Investor
|
S&P 500 5,027
NASD 15,991 Ru 2k 2,010 Ex-US 50.69 11 Feb 2024 |
The S&P 500 just closed above 5,000 for the first time ever
The Fed keeps getting more ammo for its argument to hold off on rate cuts, and suddenly investors don't seem to mind too much. After all, we got a January jobs report that was nearly double (353k vs 185k) what was expected, earnings are coming in hotter than expected, and inflation keeps dropping closer to that 2% magical rate. Instead of throwing a fit over more hawkish Fed talk, investors pushed the S&P 500 to record highs, with the benchmark index closing above 5,000 for the first time ever to cap off the week. What we consider to be the most undervalued area of the market, small caps, led the charge this week, with the Russell 2000 index returning 2.54%; that rally was made even more impressive considering the index closed Monday down 1.3%. Small caps (companies $250M to $2B in size) are still down about 1% year to date, however, meaning they remain attractive—as do mid-cap stocks ($2B to $10B in size). Another area which remains in the red for the year is international stocks, with the MSCI All Cap World Index ex-US off 69 bps in 2024. Rather amazingly, they are even negative looking back three years (-2% three-year return). Unlike small- and mid-cap US companies, however, we don't see much we like in developed economies outside of the US. We do have a lot of conviction in one emerging market, however: India. Not only did that country just overtake China as the world's most populous nation, we also expect its GDP to grow faster than the communist nation's in 2024. We recently added an India-focused ETF to the Penn International Investor to take advantage of this condition. We will probably avoid a recession this year, but the geopolitical landscape is as ugly as the domestic political landscape. Without delving too deeply into the matter, suffice to say that the dysfunctional state of US politics should worry us all. We have never felt more uncomfortable about a national election than we do this year. Neither leading candidate seems concerned about the $34 trillion national debt (123% the size of our economy), and Congress appears to be frozen due to internecine battles. In short, while we are off to a strong start for 2024, there are a lot of powder kegs which could blow before the general election rolls around. At least we can once again find relative safety in the fixed income market. |
|
S&P 500 4,697
NASD 14,524 Ru 2k 1,951 Ex-US 50.21 06 Jan 2024 |
It was a rough start to the new year; earnings season now in focus
There wasn't much to hang our hats on in the first week of 2024—about the only component of the markets in the black was crude, which rose from $71 to $74 per barrel. All of the so-called Magnificent Seven stocks—the big tech names that led the charge in 2023—fell this week, with the NASDAQ plunging 3.25%. Small caps, as represented by the Russell 2000 index, dropped 3.72%. Even bonds fell in value as investors reassessed their bullish call for Fed rate cuts. On that last point, we continue to believe the Fed won't deliver near the cuts this year that the market is pricing in. Most analysts are calling for between five and seven cuts, with the federal funds rate dropping from a range of 5.25%/5.5% down to 3.75%/4% (lower/upper limits). We tend to believe the Fed's own projection for three cuts in 2024, and that those will come later in the year than most expect. Now that the first week of the year is in the books, attention can turn to earnings season. We remember the old days when all eyes would be on Alcoa's (AA $32) results to get a feel for how the season would shape up; now, it will be the big banks which act as the barometer. Bank of America (BAC $34), Citigroup (C $54), JP Morgan (JPM $172), and Wells Fargo (WFC $50) all report before Friday's opening bell. Wall Street expects an aggregate 1.3% growth rate in the fourth quarter, and a meager 0.8% full-year earnings growth rate for 2023. That bar doesn't seem too high; we believe actual results will surpass expectations. Historically, "as goes January, so goes the year." Corporate earnings will, we hope, be the catalyst needed to lift us out of this little pothole we dug in the first four trading days of 2024. |
|
S&P 500 4,595
Dow36,246 NASD 14,305 Ru 2K 1,863 02 Dec 2023 |
One of the two best Novembers since 1980
It was the best month of the year and one of the two best Novembers in the market since 1980; sweet relief after a horrendous three-month period. A plethora of good news led to the rally, but the general sense that the Fed is done raising rates was the key component. Corporate earnings accounted for the second nice surprise, with S&P EPS jumping 6.3% Y/Y (11.6% ex energy). That is the fastest growth clip since the second quarter of 2022, and well ahead of what analysts were calling for. As if the 4.9% GDP reading for Q3 wasn't good enough, that figure was revised up to 5.2%. That would typically worry Fed watchers, as it gives hawks another argument for raising rates yet again. That didn't happen this time, however, as clear signs are emerging that the rate of inflation is slowly falling back down into the desired range (disinflation). We still don't believe there will be rate cuts in the first half of next year, but that expectation also helped buoy the markets. Another good sign came from the housing market. It was just over a month ago that the 30-year average mortgage rate hit 8%; that figure has now dropped to 7.22% and appears to be heading back down to a six-handle. Home sales, which had fallen to a 13-year low in October, began picking up steam once again in the last few weeks of November. With all of the good economic and market news, let's not forget about the bond market. After a bruising few years, bonds just posted their strongest rally since the 1980s. The 10-year Treasury, which topped out at 5% in October, finished Friday with a yield of 4.22%. We have been increasing our exposure to fixed income investments—and increasing duration—since spring, and it has paid off nicely. We also added a 20-year Treasury bond proxy to the Strategic Income Portfolio a few weeks ago—it has rallied 10% since (bond values go up as rates fall). Will the early Santa Claus rally continue through the end of the year? We believe so. We also see small-caps making up for lost ground (the Russell 2000 was flat YTD going into November), and value stocks staging a comeback. One of our biggest calls of the year was for gold to have a huge rally: the precious metal hit a new all-time high on Friday of $2,092 per ounce, and we are bullish on it for the coming year as well. After such a strong November, investors should use the month of December to assure they are allocated properly going into 2024, and to consider some tax-loss harvesting. |
|
S&P 4,358
Dow 34,061 NASD 13,478 Russell 1,761 04 Nov 2023 |
A refreshing start to the "best six months of the year"
Finally. After a brutal quarter in the stock market, three months in which the Dow fell an average of 1,000 points per month, we have signs of life. Ironically, this past week's strong gains came on the back of soft jobs data; well, that and the announcement that the Treasury will "only" need to borrow $776 billion in the final quarter of the year. The Treasury Department news kicked the week off when it announced on Monday that it would be issuing $776 billion worth of debt in Q4 and $816 billion between January and March. This announcement came ten days after it was revealed that the government had spent $1.7 trillion more than it brought in for fiscal 2023. It is amazing what counts for good news these days. The market also liked the quarterly refunding report issued Wednesday morning. This report, which gives the specifics of what debt the Treasury Department will be issuing, showed a skewed issuance of shorter-maturity Treasuries as opposed to ten-year or longer maturities. By the laws of supply and demand, this helped bring the 10-year Treasury yield down, helping bonds to rally. Then came the scheduled FOMC meeting on Wednesday. Not only did the Fed not hike rates again, Powell gave a relatively dovish press conference. Despite the effort of some journalists and their boneheaded questions almost begging Powell to be hawkish (Michael McKee of Bloomberg wins the booby prize for the dumbest), investors walked away believing that the current rate hike cycle is officially dead. Add a cooler-than-expected jobs report for October, and it was off to the races in the market. By Friday's close, the markets had pieced together their best week since October 2022. The biggest winner was the Russell 2000 small-cap index, which had been down 7% year-to-date. It erased all of the year's losses and is now sitting up 7 basis points for 2023. The Nasdaq rose 6.6% for the week, followed by the S&P 500 (5.85%) and the Dow (5%). As if that weren't enough good news, oil fell 5% and bonds rallied 2% on the week. A better script for the first week of the best six months of the year couldn't have been written |
|
S&P 3,917
Dow 31,862 NASD 11,631 Russell 1,726 19 Mar 2023 |
Bank failures and Fed speculation drove the markets this week
At the end of this frenzied trading week, it was fitting that the only green which would show up on Friday, St. Patrick's Day, was gold—it rose 6% over the course of five days. Rising gold prices are often in response to economic instability and concerns over monetary policy, so the precious metal's surge makes perfect sense. The week began with news of Signature Bank's collapse, and the only thing standing in the way of a market rout was the government's promise that all depositors at the failed banks would be immediately made whole. The focus quickly turned to what Fed Chair Powell would do at the following week's FOMC meeting. We went from high odds for a 50 bps hike, to calls for an immediate pause while the damage was assessed, to expectations for a 25 bps hike (what we have been—and still are—expecting). Odds increased for the last option when ECB President Christine Lagarde stuck by her guns and raised rates in the EU by 50 bps. Any pause, the pundits argued, would signal fear that the government didn't believe it could contain the new banking crisis. By late in the week, the domestic banking crisis made its way across the pond to a troubled European institution: Credit Suisse. After the company delayed its annual report and shades of SVB and Signature began gripping investors, the largest shareholder—the Saudi National Bank—said it would not come to the rescue with new funding. On Friday, the Financial Times reported that fellow Swiss bank UBS might be a reluctant suitor (earlier in the week, the $57 billion behemoth said it had little interest in buying the troubled bank). As we write this, UBS has offered $1 billion to take over Credit Suisse, which had a market cap of $35 billion just two years ago and $8 billion at the beginning of the month. Meanwhile, Switzerland is considering nationalizing the firm if the UBS deal fails. Stunning. Considering everything that happened over the course of five days, it is rather impressive that the benchmarks were relatively unchanged. The NASDAQ, in fact, gained 4.4% on the week. One thing is certain: tech startups which had little trouble securing loans in the zero interest rate environment are going to face much higher hurdles—and debt servicing costs—going forward. Which makes it somewhat strange that the tech-laden benchmark put together a positive week. The same issues that drove markets this past week will drive them this week: global concerns about the financial strength of middle market and regional banks, and how the Fed will balance battling inflation with these new banking concerns. Expect the Fed's balance sheet reduction program to be placed on pause just as it was beginning to show results. |
|
S&P 3,901
Dow 32,862 Nasdaq 11,102 Russell 1,847 28 Oct 2022 |
The foolishness of the mainstream media was on full display this week
Back in July, as the market was rebounding from its June lows, CNBC’s Jim Cramer frantically declared, “The market hit its bottom on June 16th!” Of course, he was proven wrong just a few months later. After the September bloodbath, Jim Cramer told his viewers that he had been talking to a lot of “big investors,” and they were all telling him the S&P 500 would take out 3,000 on the way down, and that the fed funds rate wouldn’t stop until it hit 6%. At the time, the S&P 500 was at 3,657 (we looked at the ticker the minute he made his rant). This was before what is shaping up as the best October in decades. Yes, big tech got hit this week on weaker-than-expected earnings and some sobering guidance. But let’s take Apple (AAPL $156) as an example of just how reactionary the press really is. The minute the Cupertino-based giant announced a miss on iPhone 14 sales, and that revenue growth could slow during the coming holiday season, AAPL futures dropped some 8%. Immediately, the panel of esteemed hosts on a certain business channel began falling all over themselves to explain why the stock was down, how they saw this coming, and the bad things it portended for Apple as a company. The next day, instead of following through on the 8% drop, Apple shares climbed 8%—a 16% swing from the post-earnings futures. You would think these individuals would stay mum based on their previous afternoon’s comments. No, instead they doubled down on their dumb comments. We find it highly impressive that, following some rather glum reports and guidance, all the major benchmarks were up this past week—including the Nasdaq (where the tech giants live). While we still haven’t clawed back September’s brutal losses, we are making good progress. This tells us investors believe a couple of things: that the Fed is going to do another 75-basis-point hike next week but then indicate a slowdown of the rate of increases; and that earnings are not coming in nearly as bad as feared, despite the FAANG disappointments. We believe they are correct on both counts. Too late to go back and declare another market bottom in September, Cramer, that ship has sailed. We believe we are in the early stages of a Santa Claus rally, buttressed by a Fed slowing its pace and by the mid-term elections. Who will lead the charge? Probably the small caps, which have been severely beaten down and are spring-loaded for a comeback. |
|
S&P 3,640
Dow 29,297 Nasdaq 10,652 07 Oct 2022 |
It was a positive week in the markets, so why didn’t it feel that way?
The week began with the best two-day rally since April of 2020, with the S&P jumping some 5.6%. A few signs arose which gave the market hope that inflation was starting to be tamed, which might lead to the end of rate hikes. Wednesday was flat, Thursday investors began to worry, and Friday’s strong jobs report capped the U-turn. The unemployment rate fell from 3.7% to 3.5%, the labor force participation rate remained steady at 62.3% (we need more workers rejoining the labor force), and 263,000 new jobs were created—more than anticipated. We are back to the bizarre world where good news is bad news. This all but assured more rate hikes, with odds strong for a 75-basis-point hike in November, followed by a 50- and then 25-bps hike in December and January, respectively. That would put the upper limit of the fed funds rate at 4.75%, at which time Powell and company should be able to put the tightening on hold. That probable scenario spooked the Dow into a 630-point selloff on Friday, which is absolute silliness. A 4.75% rate is not economy crushing, as we have weathered much higher rates in the past. The average 30-year mortgage loan now comes with a 7% APR, which has certainly dissuaded homebuyers and seized up the refinance business; but runaway home values are beginning to level out—an important component to controlling inflation. Another big weight on the markets this week came courtesy of OPEC, which promised to curb oil production by two million barrels per day. The cartel’s aim is to stick it to Biden while getting oil prices closer to triple digits, and it seems to be working: the price for a barrel of crude rose from $79.74 before Monday’s open to $93.20 by Friday’s close. By the end of the week the Dow had actually pulled off a 1.99% gain, followed by the S&P 500 at +1.5% and the NASDAQ at +0.72%. Market emotions were on full display over the five-session period, going from hopeful anticipation on Monday to depressed capitulation on Friday. It may seem odd, but these kinds of wild swings are often the precursor of something good waiting around the corner. It has been a painful year, but we are now in the bottoming-out process. When the market senses that the Fed is near the end of tightening, there will be a rally akin to the one we experienced during the vaccine phase of the pandemic. Barring, of course, a cornered Russian thug doing something even more horrific than he already has. |
|
S&P 3,693
Dow 29,590 Nasdaq 10,868 23 Sep 2022 |
Another bruiser: markets have now given up two full years of gains
For the past two weeks in particular, the markets have had a myopic fixation on what the Fed’s next moves will be. The Tuesday before last, the Dow Jones Industrial Average lost 1,276 points after a hot August inflation read all but guaranteed a three-quarter-point rate hike in September. This Wednesday, when the Fed delivered, it dropped another 522 points. With the NASDAQ and Russell (small caps) leading the retreat, the major indexes all dropped around 10% over the past ten trading sessions, falling back to October of 2020 levels. So much for the June lows—those were taken out Friday intraday before bouncing slightly. It wasn’t only the Fed, though that was the big catalyst. The other concern markets seem to be stewing about is the strong US dollar, which is at its highest level in precisely two decades. That makes imports and overseas travel cheaper for Americans, but our exports more expensive for the world. But the strong dollar shouldn’t affect US small-cap companies much, as most rely on the domestic marketplace for the lion’s share of their revenues. It has been a brutal year thus far, but if our economy cannot handle a dollar at parity with the euro and a potential 5% federal funds rate, then that is a sad testament to American exceptionalism. In reality, the US economy can and will be able to deal with these two conditions—a strong dollar and higher rates; it is investors who seem unable to come to terms with the situation. Great American companies, flush with cash and on strong growth trajectories, have not been spared during this latest selloff, which makes little sense. Until the madness abates, we are taking advantage of the dislocation in short-term rates by buying Treasuries, agencies, and quality corporate bonds. |
|
S&P 500
3,825 DJIA 31,097 Nasdaq 11,128 Russell 1,727 |
Worst first half of the year since 1970, but where do we go from here?
(01 Jul 2022) There have been a lot of comparisons to the 1970s floating around recently, and for good cause. After all, many of the same antagonists we faced fifty years ago haunt us today: China, Russia, inflation, high oil prices, and general economic malaise. Then there are the market comparisons. Yes, we have just closed out the worst first half of any year for the S&P 500 since 1970, and for the Dow Jones Industrial Average since 1962. Furthermore, the Nasdaq and Russell 2000 (small caps) just had their worst start to a year--ever. Anyone listening to the doom and gloom in the press and among economists certainly don’t feel much like buying. It is as if the all-but-guaranteed recession at our doorstep will mean the end to life as we know it. The negativism is palpable. As we have recently noted, the entire decade of the 1970s was not kind to the markets; however, it was not just one big ten-year decline for the indexes. After dropping around 25% in the first half of 1970—eerily similar to 2022—the S&P 500 actually gained back nearly all of its losses on the back half, finishing the year down under 1%. While the Nasdaq didn’t come about until 1971, the same could be said of many of its would-be components back then. At the end of the first half of this year, the S&P, Nasdaq, and Russell 2000 all found themselves in bear market territory, as defined by at least a 20% drop. The Nasdaq got hit the hardest, falling 30%. Bonds, which are supposed to provide a hedge to market losses, dropped 10.7% in aggregate over the past six months. Investors now seem certain on more rate hikes, a recession, terrible corporate earnings, a continuing war in Ukraine, and stubbornly persistent higher oil and gas prices. In other words, the stock market now reflects the worst of all possible outcomes for the second half. This has created a condition in which large tech names like Microsoft, Apple, Adobe, and Amazon appear as though they are value plays. And large cap core/value names like Dollar General, Target, Pfizer, Home Depot, and Lockheed Martin have multiples that would have made investors drool last summer. All of these companies have rock solid balance sheets and strong fundamentals, it should be noted. The last time we remember solid companies selling off like this was March of 2020. June, it just so happens, was the worst month in the market since (you guessed it) March of 2020. Fear and gloom have taken over. Historically, with respect to equities, that has nearly always been the time to buy; never the time to panic. Will the second half of the year be an encore to the second half of 1970? While we can’t say for sure, it wouldn’t surprise us a bit. Nonetheless, protection on positions and a larger allocation to cash (as we await higher rates which will lead to better bond values) are certainly prudent measures to maintain right now. |
|
S&P 500
3,974 DJIA 31,880 NASDAQ 11,535 Russell 2000 1,773 |
Consumer staples fell dramatically last week, but the Dow is attempting a comeback
(23 May 2022) If there was one positive sign in this five-month-long anxiety-riddled market tumble, it had been the fact that consumer staples—those stolid, earnings-rich companies that sell goods people need under all economic conditions—were holding their own. That changed last Wednesday after Target (TGT $155) shocked the market with news that profit margins were getting seriously crimped by high inflation—from higher fuel costs to a spike in commodity prices. This exemplary company, which was up around 300% since we added it to the Global Leaders Club, lost one quarter of its value in one day; its worst one-day hit since 1987. And it wasn’t just a Target problem. The prior day, Walmart’s (WMT $122) earnings showed the same challenges, pushing WMT shares down 11%. Ironically (or not), that was also their worst single day since 1987. We all know what happened in 1987. I was in the US Air Force rather than a cushy chair at an investment firm back then, but I remember the fear being palpable. There really wasn’t a single major catalyst that would explain away the massive market drop, which was part of the problem. Investors feel better if they can point to a viable reason for a system shock, and there wasn’t one in October of 1987 (though there was a confluence of events, much like today). Many investors made the worst possible mistake that month: they began selling even their best positions. Over the course of the next six months or so, the Russell 2000 (small caps) had rallied 37%, the NASDAQ was up 32%, and both the S&P 500 and Dow were up 20%. Those who sold in October missed a remarkable rally right around the corner. This is not March of 2000. The current bear market much more closely resembles the one which occurred in the fall of 1987. Inflation is real, and the Fed will do what it takes to get it under control (raise rates and reduce the balance sheet), which may push the economy into a mild recession next year. But we wouldn’t be surprised to see the same type of rally occur in the second half of this year that began on 7 December 1987. Friday afternoon and Monday’s follow through may portend that coming rally: the Dow was down over 600 points with a few trading hours left in the week, only to rally into a positive close. That rally continued Monday, with the Dow finishing up 618 points—or more than 1,200 points higher than Friday afternoon’s low. Of course, we have no way of knowing whether the bottom of this current market downturn is in, but it is refreshing to see buyers jumping back in after being pummeled for seven straight weeks. |
|
S&P 500
4,272 Dow 33,811 NASD 12,839 Russell 2000 1,941 |
There are different strains of downturns; investors should not sweat this week's garden variety
(22 Apr 2022) Investors are going to have to accept this simple fact: the markets will throw a number of tantrums during the Fed's tightening cycle, despite the irrationality of doing so. Quite often, there are very good reasons for a market selloff. March of 2020's downturn, based on the uncertain nature of a global health threat, was a good reason. When markets are vastly overvalued, like they were in March of 2000, that becomes another good reason for a big drawdown. Sometimes, however, the market sells off for very inane, irrational reasons. Chalk this week's downturn up to the latter. It was another one of those weeks when nothing worked: all of the major equity benchmarks fell, as did gold and oil. Bonds typically go up as equities go down; this past week, headline after headline read: "The Global Bond Market Rout." And it was, indeed, the bond market which drove equities lower. If anyone doesn't expect the Fed to raise rates 50 basis points at the May meeting, they have had their head in the sand. Let's be clear: fear of rate hikes is a really dumb reason for a market selloff. Even if Powell and company raise rates at every single meeting for the next year, we will still be below the historical average. The markets can withstand this course of events, despite the investor fits which will be thrown along the way. Here's why we are actually excited about the coming hikes: we will finally be able to pick up some decent-yielding bonds once again, which will mean stronger portfolio allocations. And at some point in 2023, when the Fed will be forced to reverse course due to a looming recession, those bonds are going to look mighty good sitting in our portfolios. Tech stocks and small-caps have been hit the hardest this year, with both areas not far away from bear market territory. Scan some of the P/E ratios of strong tech/small-cap holdings; you might be surprised at how cheap they are. Want an example? Coinbase Global (COIN $132), a company we hold in the New Frontier Fund, had a P/E ratio of 172 one year ago; it currently holds a multiple of ten. Bargains abound, just choose wisely. |
|
S&P 500
4,371 Dow 33,970 NASD 13,631 Russell 2000 2,030 |
Invasion Day: What we can learn from the Dow's near-1,000 point swing last Thursday
(25 Feb 2022) Considering the headline, "Russia invades Ukraine," last Thursday's early session bloodbath certainly seemed to make sense. The Dow was in the red by 859 points in short order, causing us to have flashbacks to the multiple 2,000-point-drop days in March of 2020, almost two years ago to the month. All of the major indexes were off by 2.5% or more. Then, something remarkable happened: the markets staged their great comeback. Led by the NASDAQ, then followed by the S&P 500 and—grudgingly—the Dow, all of the indexes ended the day in the green. For the Dow, that represented a 963-point swing from bottom to close. The S&P 500 ended the day up 1.56% while the NASDAQ was in the green by 3.34%, with many recent "opening trade punching bags" moving higher by double digits. The knee-jerk reaction coming from analysts was that the market liked President Biden's new round of measured sanctions—just enough to potentially make Putin think twice about his course of action, but not so draconian as to hurt Western allies (like limiting the flow of Russian gas and oil, or cutting Russia out of the Swift global payment system). But the rebound, we believe, goes a bit deeper than that. In the first place, it all but assured a more measured pace of Fed rate hikes and balance sheet tightening, as opposed to the 50-basis-point March hike and seven rate hikes that the likes of Bank of America had been calling for (we never believed that would happen). Additionally, we felt a real sense that many investors who had been waiting for the bottoming of the recent market trough decided that this was the moment to get back in. That notion was buttressed by Friday's 835-point Dow follow through. Time will tell whether or not this represented a turnaround from the brutal past few months, but the rapid shift in market sentiment was heartening. CNBC's Bob Pisani perhaps put it best when he said, "I've been on the (trading) floor for twenty-five years; you don't see many weeks like this." If we are on the happy side of a bottoming out, here is a tempting morsel for would-be buyers: 51% of S&P 500 stocks and 76% of NASDAQ stocks are still in bear market territory. Many quality NASDAQ names (strong revenues, needed products and services) remain 50% or more below their 52-week highs. |
|
S&P 500
4,516 Dow 35,132 NASDAQ 14,240 Russell 2000 2,028 |
As goes January, so goes the year? Hopefully not
(01 Feb 2022) Even with a nice rally on the final trading day of the month, January was messy. In fact, it turned out to be the worst start to a year since the global financial crisis. For tech stocks, as benchmarked by the NASDAQ, it was even worse: the index had its second-poorest opening month of the year since its inception. But even the NASDAQ performed better than the small caps, which briefly entered bear market territory with their 20.94% drop from November highs. (The NASDAQ skirted a bear market, missing by three percentage points.) It was not quite as bad for the Dow and S&P 500, which fell as much as 7% and 10% from their highs, respectively. Was the month just a blip following a strong year, or do we believe the old "as goes January, so goes the month" adage? Let's begin by analyzing the catalysts—other than a strong preceding year—for the downturn. Overwhelmingly, it was the Fed (rate hikes), the Russians (potential invasion of the Ukraine), and concerns over weakening earnings. For the tech stocks which were pandemic darlings, sky-high valuations are being reevaluated as the global workforce moves back, albeit slowly, into the office environment. We know what has happened to the Peloton's of the market, but consider this: shares of DocuSign (DOCU $125) fell 60% from their high price, while Zoom Video (ZM $151) fell 76% from October highs. It was the worst overall month for the markets since March of 2020, which investors recall all too well. That period, however, turned out to be one of the best buying opportunities in the past decade. Time will tell whether or not January will have provided a similar opportunity. While our buying spree is nothing like that of late spring/early summer of 2020, we have been picking up some deeply undervalued names. The selling was relatively indiscriminate, as witnessed by drops in the likes of Microsoft and Apple. While scouring for deals, look for companies with fat earnings, pricing and staying power, and nice dividend yields. Also, scan small-cap equities which are domestically focused; the drop in the Russell 2000 has presented some excellent buying opportunities. Finally, don't be afraid to put stop-loss orders on positions to protect gains or limit losses—there will be other chances to pick these companies back up at lower levels if warranted. And remember, cash is an asset class in which every investor should be allocated. |
Six companies which played an outsized role in the headlines this past year
(24 Dec 2021) To break the year down by headlines in the business media, six companies dominated the news. It is hard to believe, but the meme stock craze just started back in January of this year when the reddit brigade drove the price of GameStop (GME $152) up from around $20 per share to a stratospheric $483 per share on the 28th of the month. In a coordinated effort to attack the shorts, AMC Entertainment (AMC $29) and several other heavily-shorted names became meme stocks shortly thereafter. The beneficiary of this craze, at least initially, was a new trading platform for the masses: Robinhood (HOOD $19), which went public in late July and attained an $85 share price a week later. The company has since lost three-quarters of its market cap. The crypto craze hit full stride by late spring when the Coinbase (COIN $268) platform went public. Nearly 100 cryptos can be easily traded on the platform, and users can make payments from the app using the coin of their choosing—or the US dollar. Coinbase is in the Penn Intrepid Trading Platform and remains one of our favorite plays going into 2022. Pfizer (PFE $59) has been the corporate hero of the pandemic, providing the world's best vaccine to prevent Covid, and the first approved therapy to treat the disease. Tesla (TSLA $1,067), which is in the Penn New Frontier Fund, has been in the headlines throughout the year for a number of reasons, from Elon Musk's entertaining tweets to the company's remarkable production levels to the fact that it became a $1 trillion company this year—one of only a handful. Meta Platforms, yet another Penn name, has been in the headlines for mostly negative reasons this year (via incessant attacks by elected officials), though investors have largely brushed off these headlines. The company, which changed its name from Facebook in October, is up 25% year-to-date. Finally, we have TikTok. We have nothing to say about TikTok. Several of these companies will remain solidly in the headlines throughout 2022, but new and unexpected additions will certainly arise. For a number of tech darlings which have yet to turn a profit, many of the headlines will be anything but positive. Investors need to watch their high-beta positions diligently, as volatility will rule the year.
(24 Dec 2021) To break the year down by headlines in the business media, six companies dominated the news. It is hard to believe, but the meme stock craze just started back in January of this year when the reddit brigade drove the price of GameStop (GME $152) up from around $20 per share to a stratospheric $483 per share on the 28th of the month. In a coordinated effort to attack the shorts, AMC Entertainment (AMC $29) and several other heavily-shorted names became meme stocks shortly thereafter. The beneficiary of this craze, at least initially, was a new trading platform for the masses: Robinhood (HOOD $19), which went public in late July and attained an $85 share price a week later. The company has since lost three-quarters of its market cap. The crypto craze hit full stride by late spring when the Coinbase (COIN $268) platform went public. Nearly 100 cryptos can be easily traded on the platform, and users can make payments from the app using the coin of their choosing—or the US dollar. Coinbase is in the Penn Intrepid Trading Platform and remains one of our favorite plays going into 2022. Pfizer (PFE $59) has been the corporate hero of the pandemic, providing the world's best vaccine to prevent Covid, and the first approved therapy to treat the disease. Tesla (TSLA $1,067), which is in the Penn New Frontier Fund, has been in the headlines throughout the year for a number of reasons, from Elon Musk's entertaining tweets to the company's remarkable production levels to the fact that it became a $1 trillion company this year—one of only a handful. Meta Platforms, yet another Penn name, has been in the headlines for mostly negative reasons this year (via incessant attacks by elected officials), though investors have largely brushed off these headlines. The company, which changed its name from Facebook in October, is up 25% year-to-date. Finally, we have TikTok. We have nothing to say about TikTok. Several of these companies will remain solidly in the headlines throughout 2022, but new and unexpected additions will certainly arise. For a number of tech darlings which have yet to turn a profit, many of the headlines will be anything but positive. Investors need to watch their high-beta positions diligently, as volatility will rule the year.
|
S&P 500
$4,296 |
September was terrible and October opened with spooky volatility, but several factors point to a positive fourth quarter
(06 Oct 2021) Just to keep the market's recent pullback in perspective, we looked back at our start-of-the-year prediction of where the S&P would end up in 2021: 4,300. That would have meant a healthy 14.5% return for the year. Despite the ugly September the markets suffered through (September is historically the worst month of the year), we went into October with the S&P 500 sitting at 4,308, or eight points above where we expected it to be by the end of December. Furthermore, a fresh wave of volatility has gripped the first week of the new quarter. Does that mean we now expect a flat Q4? Not at all. The cause for the negative quarter was, overwhelmingly, the virus's Delta variant and the subsequent global supply chain issues. While this new strain constricted our massive economic comeback, we believe the new therapies being rolled out by Merck (MRK $81), Pfizer (PFE $43), and others, as well as quick, at-home testing kits by the likes of Abbott Labs (ABT $117), will have us back on track in short order. Of course, we still have the fiscal battle in Washington playing out through the end of the year, but one party, for all intents and purposes, controls both houses and the White House, so something will get done. Fortunately, a few moderate Democrats will make sure that the president's $3.5 trillion budget wish list gets pared back before offering up their votes, but don't expect a government shutdown this time around. Do, however, expect another few trillion to get added to our irresponsibly-monstrous national debt. Small caps, as represented by the Russell 2000, got hammered in September. This is a good area to start looking for bargains, especially on heavy down days. Stick with value plays showing rock-solid earnings and staple offerings—those which cannot be easily replaced (or discarded) by budget-wary consumers. Industrials and health care are two strong sectors to overweight in the fourth quarter; some low-multiple utilities plays also look attractive. And remember, cash is an asset class. As such, even the most aggressive portfolio should have a fair representation of cash and cash equivalents. |
In a stunning turnaround, two of the three major indexes actually cobbled together a positive May
(31 May 2021) It wasn't looking very good a few weeks into the new month. In fact, the "Sell in May..." adage seemed destined to, once again, prove true. However, after hammering out a solid second half of the month, both the S&P 500 and the Dow Jones Industrial Average ended May in the green—though not by much. While the NASDAQ couldn't make that happen, it did end up paring its earlier losses, finishing down just 1.53% on the month. Inflation fears seemed to grip the stock market in the first two weeks of May, while plenty of expert witnesses helped to effectively allay those fears during the second half of the month. For crypto investors, the story was more dour. Bitcoin lost one-third of its value in May. Bring on the dog days of summer, and strap in for a wild ride.
(31 May 2021) It wasn't looking very good a few weeks into the new month. In fact, the "Sell in May..." adage seemed destined to, once again, prove true. However, after hammering out a solid second half of the month, both the S&P 500 and the Dow Jones Industrial Average ended May in the green—though not by much. While the NASDAQ couldn't make that happen, it did end up paring its earlier losses, finishing down just 1.53% on the month. Inflation fears seemed to grip the stock market in the first two weeks of May, while plenty of expert witnesses helped to effectively allay those fears during the second half of the month. For crypto investors, the story was more dour. Bitcoin lost one-third of its value in May. Bring on the dog days of summer, and strap in for a wild ride.
|
S&P
4,174 Dow 34,382 Nasdaq 13,430 |
Inflation fears brought an ugly first half to the week for the markets, followed by an impressive comeback effort
(14 May 2021) The extent to which investors have been indifferent about inflation concerns is rather remarkable, considering the grand economic reopening which is in its nascent stage and the mounting evidence that the concern is real—as evidenced by the price of everything from used cars to commodities. Perhaps they were taking solace in Jerome Powell's nonchalant attitude, with the Fed Chair almost daring inflation to try and stir trouble. That changed this past Wednesday when, following two previous down days, the major indexes threw a major fit over the latest Consumer Price Index (CPI) report. The CPI, which measures the rate of change in the price of a basket of consumer goods, spiked 4.2% YoY, above the lofty expectations for a 3.6% reading. That jump represents the sharpest spike since September of 2008. By Wednesday's close, the major indexes were off between 2% and 2.67%, with the NASDAQ getting hit the hardest. Fears that the Fed would have to act sooner rather than later to rein in inflation seemed to abate after the mid-week bloodbath, with the Dow gaining nearly 1,000 points during the last two sessions, and the S&P gaining 110 points. Stocks typically face a higher level of volatility in May, as investors seem intent on proving the "Sell in May..." adage. What is the right course of action after such a volatile week? Take a good look at your portfolio's allocation to assure the fast-growing tech positions didn't knock it out of whack; also, position more toward the value side of the equation. On that note, take a look at our latest addition to the Dynamic Growth Strategy by visiting the Penn Trading Desk. |
Jamie Dimon sees economic boom continuing into 2023, but also sees challenges to address
(07 Apr 2021) In his annual letter to JP Morgan (JPM $153) shareholders, CEO Jamie Dimon said he sees strong growth for the American economy "easily running into 2023." Dimon, one of the most astute watchers of the market, listed a host of factors for his bullish sentiment on the world's largest economy: the remarkable speed at which a vaccine was developed, excess savings for the typical American family after being homebound for much of the past year, huge deficit spending, more quantitative easing by the Fed, a new infrastructure bill, and general euphoria that the long global nightmare may finally be coming to an end. His letter wasn't all rosy, however. Dimon sees a real possibility that inflation "will not be just temporary," and he expressed his concerns that our international rivals see a nation "torn and crippled by politics...." "The good news," Dimon concluded, "is that this is fixable." There have always been fomenters of discord and division in this country. There is no doubt that our adversaries, such as China and Russia, are stealthily acting to support such hatred and division. America is, by far, the strongest nation on earth, both economically and militarily—that is a statistically provable fact, not hyperbole. The best weapon our enemies have to harm our standing in the world is to help balkanize the country into groups pitted against one another. Their efforts will fail if we refuse to play their game.
(07 Apr 2021) In his annual letter to JP Morgan (JPM $153) shareholders, CEO Jamie Dimon said he sees strong growth for the American economy "easily running into 2023." Dimon, one of the most astute watchers of the market, listed a host of factors for his bullish sentiment on the world's largest economy: the remarkable speed at which a vaccine was developed, excess savings for the typical American family after being homebound for much of the past year, huge deficit spending, more quantitative easing by the Fed, a new infrastructure bill, and general euphoria that the long global nightmare may finally be coming to an end. His letter wasn't all rosy, however. Dimon sees a real possibility that inflation "will not be just temporary," and he expressed his concerns that our international rivals see a nation "torn and crippled by politics...." "The good news," Dimon concluded, "is that this is fixable." There have always been fomenters of discord and division in this country. There is no doubt that our adversaries, such as China and Russia, are stealthily acting to support such hatred and division. America is, by far, the strongest nation on earth, both economically and militarily—that is a statistically provable fact, not hyperbole. The best weapon our enemies have to harm our standing in the world is to help balkanize the country into groups pitted against one another. Their efforts will fail if we refuse to play their game.
|
S&P
3,811 Dow 30,932 Nasdaq 13,192 |
Despite a bruising few weeks, February was a winner in the markets
(26 Feb 2021) It may be hard to believe based on the past two weeks, but equities actually hammered out a win in February. Not so for the week: each of the major benchmarks fell on the specter of rising rates. In a sign of just how the (fixed income) world has changed, the biggest hit came when the 10-year Treasury moved above the 1.5% mark on Thursday. It actually settled back down to 1.415% by Friday's close, but the rapid upward move spooked investors who are banking on ultra-low rates supporting further advances in the market. Even talk of another $1.9 trillion in government "stimulus" couldn't help—the NASDAQ was off just shy of 5% for the week, followed by the S&P 500 (-2.46%), and the Dow (-1.78%). Nonetheless, the Dow closed out February with a healthy gain (3.17%), followed by the S&P 500 (2.61%), and the NASDAQ (0.93%). This is a far cry from one year ago as the new reality of the pandemic began to take hold. In February of 2020, the Dow was down 10.08%. Of course, those losses were nothing compared to what would follow in March. We never really know what's ahead, but it feels a lot better watching the effective Pfizer, Moderna, and (starting next week) Johnson & Johnson vaccines begin to eradicate this terrible virus than it did a year ago, facing insane toilet paper shortages and spiking hospitalization rates. If our biggest concern becomes a rising 10-year, then we really don't have much to complain about. One of these days, the realization that we now have a $30 trillion national debt will creep into our psyche, but let's focus on getting rid of the masks first. Personally speaking, our biggest concern is actually not the rising 10-year; it is the madness going on with a bunch of stocks that couldn't turn a profit if their corporate lives depended on it. When falling confetti on an iPhone screen is all it takes to lure someone into buying an overpriced dog, something wicked this way comes. Yet another reason we are tilting toward the low-multiple, deep value names this year. |
|
S&P
3,825 Dow 31,098 Nasdaq 13,202 |
Despite the disconcerting events of the week, the indexes rally to new highs
(08 Jan 2021) The image was so mind-blowing that I had to take a screenshot. The picture behind the chyron was that of the capitol building being overrun by protestors. The text on the screen read: Breaking News: House, Senate Evacuated as US Capitol Breached . In the lower right of the screen were the green numbers: DOW +465.40, % Change +1.53%. My mind raced back to one week in December of 2018 when the Dow dropped 1,884 points in four sessions due to seemingly benign interest rate comments by Fed Chair Jerome Powell. And now, the capitol is being stormed and the Dow is rallying. By the time the trading week was up, the Dow, the S&P 500, and the NASDAQ had all rallied approximately 2%. Not a bad start to 2021. Perhaps it was a rosy jobs report? Nope. There were 140,000 jobs lost in December versus an expected 50,000 gain. It was the first drop since April during the heart of the pandemic. While investors are certainly hopeful on the vaccine front, Thursday brought the deadliest day since the pandemic began, with 4,000 American lives lost. On the political front, we were told that divided government would be great for the markets, as nothing radical would take place in Congress. Instead, two special elections in Georgia brought about a blue wave. While we are still of the mindset that economies around the world will come roaring back this year as the vaccines begin to quell the deadly virus, the best word we can use to describe this week in the markets is "odd." And that is not an adjective which instills much confidence. |
Despite the wild IPO ride, markets fall on the week
(11 Dec 2020) Based on what happened in the IPO market over the course of five sessions, it might seem surprising that the three major indexes were all down for the week, but DoorDash (DASH $175), Airbnb (ABNB $139), and C3.ai Inc (AI $120) all turned out to be red herrings—shiny objects which distracted investors from the big picture. The markets falling for the week (S&P -0.96%, Dow -0.57%, NASDAQ -0.69%) was actually a healthy respite from the big run-up we've had over the past month. Counter that with the facts-be-damned trading we had in three IPO stocks, and 2021 is shaping up to be a tale of the haves and the have-nots. The haves will be the thoughtful investors looking for value, earnings, and sound business models. The have-nots will be the shiny object crowd: those using their Robinhood app like a video game to gobble up the fun-sounding names. How fitting that Goldman will bring that company public next year. A reckoning is coming, but it will be—thankfully—more discerning than the 2000-2002 variety. This one will hammer the dumb money and provide opportunity for the smart money. Bring on the new year. 2021 will be the year of the great re-build. The global economy will come roaring back with a vengeance, and GDP—both domestically and globally—will surprise to the upside. It will also be the year that tech companies with no earnings and fat valuations come crashing back to reality. Where can the smart money go? Look for opportunities in health care and industrials—boring companies that simply turn a profit year-in and year-out.
(11 Dec 2020) Based on what happened in the IPO market over the course of five sessions, it might seem surprising that the three major indexes were all down for the week, but DoorDash (DASH $175), Airbnb (ABNB $139), and C3.ai Inc (AI $120) all turned out to be red herrings—shiny objects which distracted investors from the big picture. The markets falling for the week (S&P -0.96%, Dow -0.57%, NASDAQ -0.69%) was actually a healthy respite from the big run-up we've had over the past month. Counter that with the facts-be-damned trading we had in three IPO stocks, and 2021 is shaping up to be a tale of the haves and the have-nots. The haves will be the thoughtful investors looking for value, earnings, and sound business models. The have-nots will be the shiny object crowd: those using their Robinhood app like a video game to gobble up the fun-sounding names. How fitting that Goldman will bring that company public next year. A reckoning is coming, but it will be—thankfully—more discerning than the 2000-2002 variety. This one will hammer the dumb money and provide opportunity for the smart money. Bring on the new year. 2021 will be the year of the great re-build. The global economy will come roaring back with a vengeance, and GDP—both domestically and globally—will surprise to the upside. It will also be the year that tech companies with no earnings and fat valuations come crashing back to reality. Where can the smart money go? Look for opportunities in health care and industrials—boring companies that simply turn a profit year-in and year-out.
|
S&P
|
Markets manage to knock out some pretty good gains on a shortened trading week
(27 Nov 2020) It would be hard for investors to wish for much more on a holiday-shortened trading week—periods of time which are often anything but calm (remember the ugly week preceding Christmas, 2018?). In the four trading days surrounding Thanksgiving, all three major indexes were up in excess of 2%, and the gains were relatively methodical. The technology and health care sectors led the drive, pushing both the S&P 500 and Nasdaq to new highs. While the Dow couldn't maintain the historic 30,000 mark it hit on Tuesday, it still managed to climb 647 points on the week. Two clear drivers moved the markets this week: a virtual guarantee that Covid vaccines will be available in short order, and more clarity on the political front. Considering the relatively ugly jobs report we got mid-week (778,000 new claims), we're happy to head into December with these gains on the books. Considering where we were in mid-March, it is remarkable to consider where we are at right now in the markets. We offered a rosy prediction for the remainder of the year back around the first of April, but even our projections ("S&P at 3,500") have been surpassed. December should be a relatively strong month on the back of vaccine rollouts and increased consumer spending, and the sky is the limit for 2021 as we slowly move beyond the pandemic. One of these days we will need to contend with our near-$30 trillion national debt, but odds are it won't be at the top of investors' minds in the coming year. |
|
GS
|
Goldman Sachs: The Wrongway Feldman of the investment world
(30 Oct 2020) Any true Gilligan's Island fan remembers Wrongway Feldman, the former World War I pilot known for going the wrong way and bombing his own airfield. We view Goldman Sachs as the Wrongway Feldman of the investment world. If they say it is time to short oil, our tendency is to buy. If they say buy, it is probably time to sell. Which leads us to Goldman analyst Rod Hall and his "Sell" rating on Apple, which he issued this past April. At the time, adjusting for the four-for-one stock split, AAPL shares were going for $69, and Hall's expectation was for them to drop to $58.25 (again, adjusting for the split). As of this writing, Apple shares are sitting at $110, and Hall is doubling down on his silliness, reiterating his "Sell" rating and proclaiming shares will fall to $80. Considering the stock has rallied over 70% since his last brilliant call, sounds like it is time to add to our holding. So much money can be made in the stock market by taking advantage of terrible calls and any resulting share price moves. We celebrate companies like Goldman Sachs—they have helped us create a good deal of wealth. |
The markets—a leading indicator—come roaring back in Q2
(30 Jun 2020) The stock market historically leads the economy. If that holds true this time around, the economy should be in for a roaring-good second half of the year. After the fastest market decline in US history during Q1, the Nasdaq just put in its best quarterly showing since 2001, the S&P 500 since 1998, and the Dow since 1987. While the latter two indexes are still negative for the year, all three have surged back since the dark days of March—despite a resurgence in Covid cases, which the markets have largely brushed off. Between the pandemic, racial strife, and a major upcoming election, there are plenty of unknowns remaining for the latter six months of 2020, but the stock market is showing good faith that we are back on track for solid growth, and that the Fed will continue to provide lubrication along the way.
(30 Jun 2020) The stock market historically leads the economy. If that holds true this time around, the economy should be in for a roaring-good second half of the year. After the fastest market decline in US history during Q1, the Nasdaq just put in its best quarterly showing since 2001, the S&P 500 since 1998, and the Dow since 1987. While the latter two indexes are still negative for the year, all three have surged back since the dark days of March—despite a resurgence in Covid cases, which the markets have largely brushed off. Between the pandemic, racial strife, and a major upcoming election, there are plenty of unknowns remaining for the latter six months of 2020, but the stock market is showing good faith that we are back on track for solid growth, and that the Fed will continue to provide lubrication along the way.
The pandemic was the earthquake; the earnings reports and economic data will be the aftershocks. (24 Mar 2020) We all know what happened to stock markets around the world due to the pandemic, so we won't get back into the ugly numbers. Instead, let's talk about what comes next with respect to the heinous business and economic reports that will roll in over the next quarter. We can expect a GDP contraction for the first half of 2020, the first negative period in this country since 2014. We should also brace for scary jobless claims being flashed across the news screens, and we can expect fear-mongering headlines like, "WORST SINCE GREAT DEPRESSION." Then the quarterly earnings reports will be released for the affected period, and they will be ghastly. Here's the good news, however: With the press throwing around terms like "Great Depression" and "permanent changes to the economy" (two of the plethora I made note of due to their outrageous nature) it is fair to say the worst-case scenario has already been baked into the cake. Let's face it, the "here's what comes next" headlines from journalists did a lot more harm to the markets than the actual impact from the virus and two weeks of shutdowns, simply by generating so much abject fear. So, when Americans begin rolling back into their offices, and companies begin ramping back up more quickly than anyone expected, the enormous sigh of relief should lead to some stunning days in the market. On that note...
Demand destruction or a coiled spring: Is a 50% spike in the markets possible by year-end? (25 Mar 2020) Between mid-February and mid-March, the major indexes fell by one-third. The Dow Jones Industrial Average went from just below 30,000 to just below 20,000. Mathematically, that means roughly a 50% jump in the index will be required just to get us back to where we were in the second week of February. Ditto the S&P 500 and NASDAQ, but let's stick with the Dow for our illustration, as investors seem to pay most attention to those levels. Here's the great unknown: How long will it take the markets to regain all lost ground? A recent report issued by one of the most reliable investment houses caught my attention late last week. The shocking synopsis of the report was that the major indexes will spike 50% between now and the end of the year. Right now, that seems completely unfathomable, but is it possible? We can all agree that the catalyst for this downturn was the pandemic, just like we can all agree that the 54% drop in the Dow between 2007 and 2009 was caused by the banking crisis and subsequent financial meltdown. But the two are very different beasts. One was a systemic problem for the economy, while the other is simply a short-term shock. Don't believe the headlines that this pandemic will radically change the global economic landscape. Will certain companies end up shuttering their doors for good? Absolutely. But we can expect the fiscally strong firms to come back stronger than ever. James Bullard is the president of the Federal Reserve Bank of St. Louis; his business acumen is impressive—and typically spot on. Bullard sees some jaw-dropping numbers coming in the wake of the crisis, like a 30% unemployment rate and a 50% drop in GDP for the second quarter. However, he then sees a massive ramping back up of the economy beginning in Q3 and hitting its stride in the fourth quarter of 2020 and the first quarter of 2021. If things play out the way Bullard predicts, a 50% jump in the markets by year-end is absolutely possible. That being said, forget passive funds, the money will be made in actively selecting the right companies and ETFs. On that note...
Which companies and industries to buy in a post-pandemic environment, and which to avoid like the plague. (25 Mar 2020) While the market's rapid descent seemed to indiscriminately drag everything down (including bonds), there will be clear winners and losers as we climb out of the crisis. This will certainly not be a time to go back into passively-managed index funds, like the S&P 500 or QQQ, the NASDAQ-100 fund. Why not? Because these vehicles will be chock full of both the winners and losers in the post-crisis world. Here's an example of what we mean: Microsoft (MSFT), Apple (AAPL), and Amazon (AMZN) are the three largest holdings in QQQ. These three exemplary firms will come roaring back to life this year, and that will be reflected in their respective share prices. Included in the QQQ, however, are a lot of high-tech companies with B- and C-rated financial strength, and companies in the discretionary sector which will have a difficult time regaining their pre-crisis footing. Twitter (TWTR), for example, was already having a difficult time hitting their net income goals a few months ago; what will happen to earnings as companies inevitably continue to pull back on advertising as they use their much-needed cash on more urgent expenditures—like paying their employees? We have created a number of screens to filter out the winners as we emerge from the crisis. Some of the metrics include:
Financial Strength (A to A++ financials); low relative debt load;
Industry (energy, financials, and consumer discretionary will face added pressure, while health care, utilities, and many companies in the tech sector should spring back strongly);
Products & Services (Look for products and services people needed throughout the crisis, or will immediately need once we begin going back to the offices);
Management (Sadly, there are a number of mediocre management teams out there, even among the biggest companies; a great example of this is Occidental Petroleum's C-suite, which dramatically overpaid for Anadarko Petroleum late last year, while Chevron's team had the sense to walk away. It will take highly-skilled CEOs and CFOs to shift course as needed and rebuild the hammered balance sheets);
EPS (Were quarterly and annual earnings growing going into the crisis, and how do we expect them to bounce back after two ugly quarters?);
Ownership (Have insiders been accumulating or shedding shares, and what percentage of the shares are owned by big institutions?)
In short, this will not be another 1997-1999—where just about every company was rewarded, despite their fundamentals, financials, and management teams. For both stocks and ETFs, a highly-refined selection process will be needed. If we emerge relatively quickly from this crisis, and the right mix of investments are in the portfolio, the growth between now and the end of the year could be impressive. Don't think the market can move that rapidly? Just consider the past five weeks. (Or, on the positive side, the year following the October, 1987 meltdown.)
We have a long memory: Why news of a Chewy IPO sent chills down our spine. (29 Apr 2019) Call it anecdotal, but we read a news story that immediately transported us back to the "dot-com" halcyon days of 1999...and the subsequent implosion. Chewy, the online pet store owned by PetSmart (which, in turn, is owned by private equity firm Argos Holdings), has filed paperwork for an Initial Public Offering. We vividly remember the slow-moving train wreck that was Pets.com (remember the sock puppet?), the company that symbolized the "we don't need no stinking earnings!" days of the late-'90s. We didn't feel this way when Blue Buffalo (formerly BUFF, purchased by General Mills last year) went public in 2015. We didn't even feel this way when Lyft (LYFT) went public earlier this month. But this Chewy deal has an ominous ring to it. The company has never turned a profit, nor does it have any apparent plans to ("We have a history of losses and expect to generate operating losses as we continue to expand our business"—from Chewy's filing documents). Yes, the economy is strong; and no, market valuations are not crazy-high. But when unprofitable, internet-based companies begin flooding the market, all we can say is be very careful. To borrow a term from a former Fed chair, this IPO feels irrational. Please, don't touch CHWY when it goes public. Furthermore, if by some chance it spikes 40% on its debut trading day, consider tightening the stops on your equity holdings—a storm may be a brewin'.
|
Earnings
|
What earnings recession? Q1 numbers are coming in hot. (23 Apr 2019) Remember all of the dire talk about lousy earnings reports in the first quarter of 2019 dousing hopes for a good year in the markets, and even—perhaps—portending a nearing recession? That talk is looking cheap as the first wave of earnings reports are coming in hot. Let's take a look at a few of the companies reporting, along with the percentage by which they beat the estimates: Lockheed Martin (34%), PulteGroup (25%), United Technologies (12%), Whirlpool (9%), Nucor (9%), Coca-Cola (4%). Additionally, forward guidance given by the companies has been generally positive. 20% of the companies in the S&P 500 have reported thus far, with an average EPS beat of 6.1%. Earnings concerns were a major weight on the markets going into 2019. There are certainly a slew of other concerns—especially geopolitical, but the domestic economic situation is shaping up as a nice backdrop for a positive year in the US markets.
|
|
2019
Forecast |
What the first trading day portends for the rest of the year. (02 Jan 2019) Yes, it would be quite a stretch to extrapolate one trading day into anything meaningful for the year, but here we go. Watching the futures on Trading Day 1 of 2019 felt like standing on the tracks watching the oncoming train in the distance. Dow futures were down somewhere around 400 points most of the morning, and that is where the index opened. Somehow, however, the market was able to change course late in the session, with the S&P 500, the Dow Jones Industrial Average, and the NASDAQ all posting gains. How is the day's trading a microcosm of the year? Expect to see many harrowing sessions but, in the end, the markets will finish the year in the green. How far in the green? We expect the S&P 500 to close the year between 2,800 and 2,900, which would equate to a 12-15% gain for 2019.
|
|
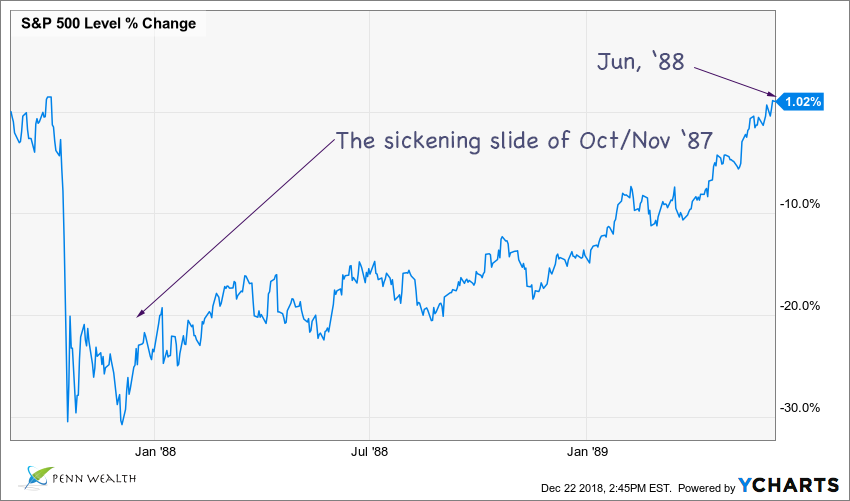
It feels a lot like 1987. (22 Dec 2018) Abject fear gripped the markets back in the latter months of 1987. Out of the blue, the S&P plunged 23% in October, followed by a 9% drop in November. Investors wanted out. That would have been a mistake, as the S&P rose about 30% by the following summer. To us, today’s markets feel a lot like 1987. When emotions are clearly ruling investors' decision-making process, a lot of money can be made by cooler heads. Be a contrarian in markets like this, but assure stops are in place in case the tide continues to turn against your positions. We don't know if this is a bottom, but we are probably very close—a great time to go bargain hunting.
|
A week to forget. (22 Dec 2018) So much for the Santa Claus Rally. Actually, the phenomenon typically happens in the last week of December, but that would be some heavy lifting to ask of just 3.5 trading days before the new year. Instead of the rally, we just got the worst week for the markets since the 2008 financial crisis, with US equities losing $2 trillion of value. December, typically one of the stronger months of the year, is heading for its worst showing since 1931. After the Santa Claus Rally comes the January Effect, which occurs as investors pick up stocks which they might have sold in December for tax-loss harvesting, and as big organizations rebalance their portfolios. The good news continues to be a relatively strong US economy, with no sign of recession on the horizon for 2019. This "feels" more like the October/November timeframe of 1987 (yes, I was invested, and yes, I had a Business Week subscription, which came to my USAF base). In October of 1987, the S&P 500 was down something like 23%, and the slide continued into November (down another 9% or so). Time will tell. In the meantime, we continue to make sure our asset allocation looks good, and check that our stops are on the appropriate positions. The median investment house forecast for 2019 (as of the start of this past week) is 3,200 on the S&P 500 by year's-end. That would represent a 33% gain between now and then. The last thing investors felt like doing by the end of November, 1987 was having money in the market. Look at the percentage increase between November, 1987 and June, 1988.
Investors got it dead wrong on Friday: a trade deal gets done and the markets rally. (07 Dec 2018) Certainly, the rise of electronic trading and "quant" funds had a lot to do with the recent selloff—when certain benchmarks hit a certain point computer programs initiate a sell. But the fundamental reason for the wild swings in this week's trading revolved around the arrest of the Huawei executive in Canada and the presumption that this quashes a trade deal between the US and China. Investors got it dead wrong: a trade deal happens and the markets surge. There will be a lot of disconcerting issues in 2019, to be sure; the trade deal with China, however, will come off the table as an issue relatively early. Many major US firms believe this as well, as evidenced by the massive stock buyback programs currently underway. Facebook's (FB $127-$139-$219) board of directors, for example, just raised that company's stock buyback plan by a whopping $9 billion. Again, there will be lot of issues to be concerned with in 2019, but major trade issues will be resolved relatively soon. Additionally, the other major disruptive issue for the markets, interest rate hikes, will cease to be a drag on the markets as the Fed continues to water down its hawkish tone. Look for a December hike and two more in 2019—very manageable for the economy in general and the housing market specifically. For the record: as of this writing the S&P is at 2,633; the Dow at 24,389; the NASDAQ at 6,969. The first two indexes are negative for the year, and the NASDAQ is up 0.95%.
Fed Chairman pushes Dow up over 600 points with dovish speech. (28 Nov 2018) It didn't take much, just one little nuanced line that "we are nearing neutral" with respect to interest rates. But that line, delivered to the Economic Club of New York by Fed Chair Jay Powell, was enough to push the Dow higher by 618 points, the S&P 500 by 62 points, and the NASDAQ by a whopping 209 points by Wednesday's close. It really was a refreshing speech by Powell, who has been especially hawkish in his views on rate hikes. Just this past summer he insinuated that we are "well below normal" with respect to rates. So, what does this mean for a December hike? Probably nothing—it is all but baked in. But it does mean that the Fed will probably limit 2019 to a few hikes and be done. We believe that this is a goldilocks scenario (overused term, we know) for rates. They will get high enough for clients to grab some decent yielding bonds, but remain low enough that the housing market won't get crushed. This actually makes us a bit more sanguine and upbeat about 2019.
|
It feels like a bottom, but what if it is something more?
(22 Nov 2018) In hindsight, it is easy to say that we should have seen the 2000-2002 market nightmare coming, but it certainly wasn't obvious in 1999. Shocks often come when you least expect them. (See article in The Penn Wealth Report by clicking button to right) |
What the mainstream media is not telling you about the tariffs. (24 Jul 2018) If we never see the words "tit-for-tat" plastered on the business channel screens again, that would be great. But the term is pulled directly from the false narratives playbook, so that won't happen. If we are to believe Larry Kudlow (see China currency story below), Xi Jinping believes the US will blink first on the topic of trade. He may be a leader for life, but the double-digit year-to-date drop in the Shanghai Composite Index has to hurt. The facts: we are allowed to export roughly $200 billion in goods to China each year, and hundreds of millions of dollars worth of US intellectual property is stolen each year by the Chinese. The Chinese export roughly $500 billion of goods to the US each year with very little friction. Journalists aren't known for their mathematical acumen, but even they must understand that the number 500 is larger than the number 200. Therefore, they must be trying to deceive. But why? Stay tuned—this is going to be a fun topic to watch unfold this year. As for the EU, one of the most arrogant Europeans around (and that is saying a lot), European Commission President Jean-Claude Juncker, is coming to Washington tomorrow. Which, by the way, is exactly why President Trump tweeted out "tariffs are the greatest!" We should get some indication as to how ready Europe is to strike a deal. i.e. is the pain threshold high enough yet?
Tariff headlines give us a great opportunity to buy as others sell. (11 Jul 2018) Most great buying opportunities are either subtle—missed by investors until they are looking at them in the rear-view mirror—or surrounded by fear. We now have an incredible buying opportunity, we believe, which holds both of these attributes. The Trump Administration announced a massive new round of tariffs which, if implemented, would affect $200 billion worth of goods currently imported from China, running the gamut from tuna to furniture. In the pre-market, Dow futures were off over 200 points on the announcement. These new tariffs would not go into effect for two months, and we believe odds are good they will never go into effect. Not because Trump is bluffing (he has proven his willingness to pull the trigger), but because China simply cannot live up to their bluster. The Chinese media (controlled by the Chinese Communist government) can talk tough until the cows come home, but tough talk belies the dire predicament their economy will be facing if these tariffs go through. The US mainstream media, in lockstep and with full predictability, immediately decried these new tariffs. The same media which, if it had a gun to its head, could not negotiate its way out of wet paper bag. Slowly but surely, Americans are becoming more suspect of the headlines, but they still caused this 200-point selloff before the open. Always have a wish-list of stocks ready to go when false narratives drag down the markets in the midst of bull runs. We do. (Let's hold our feet to the fire and see, six months down the road, how accurate we were: current indexes right now: Dow: 24,777; S&P: 2,782; Nasdaq: 7,735.)
Investors may be leery of the stock market, but this AI-managed fund is all-in
(09 May 2018) We are all aware of the burgeoning artificial intelligence field, or AI, which promises to transform virtually every aspect of our lives, from transportation to home management to health care. Not to be left out, Wall Street is also beginning to embrace the technology behind this movement. For example, the Horizons Active A.I. Global Equity ETF is a computer-driven fund, trading on the Toronto Stock Exchange under the symbol MIND, which uses a proprietary AI selection process to analyze massive amounts of data and extract underlying patterns. The fund can, for all intents and purposes, go where it wants, allocating to or away from certain asset classes at will. While many staid investors are fretting over the "sell in May and go away..." aphorism, this AI fund just made an interesting move: on April 30th it cut its cash position down to 1% (it can hold as much as 25% in cash) and increased its equity holdings to 99%. This will be a fascinating experiment to watch. Let's make a note of where the markets are today (S&P 500 @ 2,672, Dow @ 24,360, NASDAQ @ 7,267) and revisit this story at the start of the St. Leger Festival (the time it is supposed to be "safe" to jump back into stocks) on September 12th.
UPDATE (12 Sep 2018): Following up as promised, here's what we have: The S&P 500 is up 7.55% and MIND is up 2.24% since we wrote the above piece on 09 May 2018. Woops. Let's keep watching to see how it does under various market conditions.
UPDATE 2 (12 Dec 2018): Following up again, after a horrendous quarter. MIND is still underperforming the major indexes, both on a YTD scale and an October scale (during the big selloff). MIND does not seem to be performing as advertised.
Major indexes came into the week with a whimper, march out with a roar
(04 May 2018) For all of the ugliness in the Dow during the first three trading sessions of the week (why are journalists so fixated on 30 stocks?), that index ended almost precisely flat for the week—down two basis points. Ditto the more relevant S&P 500. With the tech-heavy NASDAQ's 121 point gain on Friday, that index ended the week up 130 basis points. The press corps dusted off their cutesy aphorism "sell in May, go away, come back on St. Ledger's Day" around mid-week, as could be expected, but it was nowhere to be seen during Friday's rally. Take what is on the news with a grain of salt: nearly every story is either slanted or reactionary. Better yet, learn to use their bias to make a profit off of the investors who actually buy the false narratives they are selling.
(Let's revisit this comment on St. Ledger's Day around the middle of September this year armed with these stats: The S&P 500 is at 2,663; the Dow is at 24,263; the NASDAQ is at 7,210)
The 10-year Treasury is becoming disconcertingly intertwined with market volatility
(22 Feb 2018) See Monetary Policy
(22 Feb 2018) See Monetary Policy
An unusually smooth start to the trading week
(17 Apr 2018) Don't look now (we don't want to jinx it), but all three major averages just turned positive for the year. Few trading days of late have been this perfectly laid out: At open, the Dow was up around 150 points; and then, throughout the trading day, it moved up in a tranquil and methodical manner, closing 213 points in the green and going positive for the year. The more-relevant S&P 500 finished the day up 29 points, to 2,706, and the NASDAQ rocked up 125 points. Not to put a too-fine point on it, but the low-volatility rhythm of the day was impressive. Solid early-season earnings reports have helped, along with a relative quell in geopolitical flash-points. The Dow has now risen 213 points in two consecutive trading days.
(17 Apr 2018) Don't look now (we don't want to jinx it), but all three major averages just turned positive for the year. Few trading days of late have been this perfectly laid out: At open, the Dow was up around 150 points; and then, throughout the trading day, it moved up in a tranquil and methodical manner, closing 213 points in the green and going positive for the year. The more-relevant S&P 500 finished the day up 29 points, to 2,706, and the NASDAQ rocked up 125 points. Not to put a too-fine point on it, but the low-volatility rhythm of the day was impressive. Solid early-season earnings reports have helped, along with a relative quell in geopolitical flash-points. The Dow has now risen 213 points in two consecutive trading days.
Aftershocks
(07 Feb 2018) Let's call them aftershocks following the earthquake. We have ended the last two trading days either up, or only slightly down following Friday and Monday's big slides, but the closing numbers don't tell the story. On Tuesday we had 1,000 point swings from one direction to the other, and Wednesday saw the Dow both down and up in excess of 300 points. Just one hour before the close, in fact, the benchmark index was up over 200 points, only to lose all of that, plus 19, by the end of trading. The market is looking for some footing, and that is fine. All of the components of a strong economy are still in place. It must be said, however, that the shift in market direction inversely coincided with the 10-year Treasury rate. The closer it gets to 3%, the more markets freak. That is of slight concern, considering there is probably nothing to stop three interest rate hikes from happening in 2018. Remember the taper tantrum thrown by the Dow in 2013 when the Fed announced it was done pumping $70 billion per month into the economy? It is possible we will see some form of that during the March meeting when Jerome Powell makes his first real mark on the Fed by hiking rates 25 basis points, or when the central bank actually starts unwinding its record $4.5 trillion balance sheet. When that happens, have a list of your favorite stocks (that you don't already own) at the ready.
(07 Feb 2018) Let's call them aftershocks following the earthquake. We have ended the last two trading days either up, or only slightly down following Friday and Monday's big slides, but the closing numbers don't tell the story. On Tuesday we had 1,000 point swings from one direction to the other, and Wednesday saw the Dow both down and up in excess of 300 points. Just one hour before the close, in fact, the benchmark index was up over 200 points, only to lose all of that, plus 19, by the end of trading. The market is looking for some footing, and that is fine. All of the components of a strong economy are still in place. It must be said, however, that the shift in market direction inversely coincided with the 10-year Treasury rate. The closer it gets to 3%, the more markets freak. That is of slight concern, considering there is probably nothing to stop three interest rate hikes from happening in 2018. Remember the taper tantrum thrown by the Dow in 2013 when the Fed announced it was done pumping $70 billion per month into the economy? It is possible we will see some form of that during the March meeting when Jerome Powell makes his first real mark on the Fed by hiking rates 25 basis points, or when the central bank actually starts unwinding its record $4.5 trillion balance sheet. When that happens, have a list of your favorite stocks (that you don't already own) at the ready.
Letter to clients regarding market February drop
(05 Feb 2018) It's certainly not fun to hear, read about, or watch. Following a 665-point drop on Friday, the Dow plummeted 1,600 points on Monday before closing down 1,175 points. Keep in mind there are only 30 stocks in the Dow, so a more accurate gauge would the the S&P 500, which fell 113 points today, or 4.1%. Big? Yes. But, more importantly, what does the drop signify, and will it continue?
A little perspective: today's Dow drop was the largest point drop in history, but that is due to to the law of large numbers. On Black Monday in October of 1987, the Dow dropped 508 points, but nearly one-quarter of the total index value was wiped out. Today's Dow drop equated to a 4.6% loss.
What does this portend? Let's get the bad news out of the way first. For the S&P 500 to have a reversion to the mean, or at least hit its 200-day moving average of 2,532, it would need to fall another 4.42%—a little bit worse than today's loss. While that may not happen in one day, sessions like today are typically followed by another rough one. In fact, futures are already pointing to a down open on Tuesday. So, the bloodbath might not quite be over.
Now the good news. The market is falling for "all the right reasons." There are no recessions on the horizon; in fact, quite the opposite. Investors were already on edge Friday, considering we had just completed our best January since 1987. The strong jobs report and the excellent wage growth stoked fears of inflation, and a fear that rate hikes would be swift and continual. So, news of a strong economy, more hiring, and increased wages set the tailspin in motion. At the risk of repeating myself, that's about the best possible way to start a correction.
Speaking of corrections (which, technically, are a 10%+ drop in market levels), we hadn't gone 400 days without a 5% pullback, ever, until the 400 days leading up to this current selloff. We typically have at least two per year, even in a bull market. It's no fun to see portfolio values drop, but these pullbacks are healthy and normal. They are the pressure relief valve on the lid of the markets. This correction comes as American companies are reporting record earnings, with another great reporting season on the horizon for the second quarter.
Why don't we just "hide out" in bonds until the market re-gains its footing? Typically, when the markets are falling, bonds are a great place to hang out. Not this time. We are in one of those rare moments when stock prices and bond values both happen to be moving in tandem. When interest rates go up, bond values get crushed, and interest rates have nowhere to go but up. We will move more strongly into bonds when rates warrant it, and we are still expecting three rate hikes this year.
So, in short, this pullback is certainly not fun to watch, but we will look back on it as a strong buying opportunity. We may not remember it, but we had a similar downturn in August of 2015 and January/February of 2016, along with the same scary headlines. With the US and global economies gaining momentum, we see more gains ahead, minus a little pressure relief along the way.
Markets post strongest start to the year since 1987, and now is a good time to reflect on that year
(01 Feb 2018) With January, 2018 in the bag, we can begin to gauge how the rest of the year might just look ("as goes January, so goes the year"). Of course, anything can happen in an instant to change the trajectory of the market, but here's what is in the books: The Dow ended the first month of the year up 1,430 points, or 5.8%. The S&P 500 Index ended the month up 150 points, or 5.6%. Technology stocks, as reflected by the NASDAQ, rose 508 points, or 7.4%.
By any of these three measurements, the stock market is off to its best start since 1987. Yes, we remember what happened in autumn of that year—quite out of the blue, but we also remember that the right action for investors was to stay the course (based on the subsequent comeback and rally). Overall, things aren't that different now than they were in 1987 (technological advances aside). American business is growing, we have a president rebuilding the US military, the global economy looks relatively strong, and we face the usual suspects with respect to geopolitical threats. The effective Fed Funds rate would go from 6.5% in January of 1987 to about 7.5% a week before Black Monday. We expect to see about the same 100 basis point rise in rates between now and fall.
What does all this mean? It means the similarities to 31 years ago are certainly there. We should be presented with some nice buying opportunities on any pullbacks, as they will happen for the right reasons (fear of an expanding economy forcing faster rate hikes). Now is a good time to review our portfolios, assure we are properly allocated for our own risk tolerance, and well positioned for the events we see on the horizon.
What the current market pullback means...at least to date
(30 Jan 2018) We've had a nice little pullback in the markets over the past few days. I say nice because regular, normal, relatively mild pullbacks are healthy for the markets—like pulling weeds from a garden (you are often offered a glimpse into which stocks are most vulnerable when a real correction comes along). Let's put this in perspective. We have gone 400 days without a 5% drawdown in the major indexes. This is a new record. As of the time of this writing, the Dow is down 370 points; while this seems like a big drop, this amounts to a 1.4% loss. Even with this drop, the Dow is still above 26,000. Here is the most important question to ask when the markets are falling: what was the catalyst? The answer will typically tell you how worried you should be. The catalyst for this drop was not North Korea, a Constitutional crisis, or troubling earnings reports. Rather, the markets began to drop Monday on concerns that the Fed will tighten too quickly due to strong economic activity and inflation concerns. If the market must drop (and it must), then we really couldn't have scripted a "safer" reason for that downturn than a growing economy.
(30 Jan 2018) We've had a nice little pullback in the markets over the past few days. I say nice because regular, normal, relatively mild pullbacks are healthy for the markets—like pulling weeds from a garden (you are often offered a glimpse into which stocks are most vulnerable when a real correction comes along). Let's put this in perspective. We have gone 400 days without a 5% drawdown in the major indexes. This is a new record. As of the time of this writing, the Dow is down 370 points; while this seems like a big drop, this amounts to a 1.4% loss. Even with this drop, the Dow is still above 26,000. Here is the most important question to ask when the markets are falling: what was the catalyst? The answer will typically tell you how worried you should be. The catalyst for this drop was not North Korea, a Constitutional crisis, or troubling earnings reports. Rather, the markets began to drop Monday on concerns that the Fed will tighten too quickly due to strong economic activity and inflation concerns. If the market must drop (and it must), then we really couldn't have scripted a "safer" reason for that downturn than a growing economy.
At record-breaking pace, Dow hits 26,000 on the week's opening bell
(16 Jan 2018) It was just seven trading days before that the Dow Jones Industrial Average notched a major milestone: hitting 25,000 for the first time ever. At breakneck speed, and certainly shattering all records, the Dow gained another 1,000 points, hitting 26,000 at the opening of a shortened trading week. The catalysts for the latest record were positive corporate earnings (on the back of tax reform and a deregulatory environment) and an improving global economy. Crude continued to march higher, with US Nymex trading at $64.09 at the week's open.
S&P 500 records best start to a year in over half-a-century
(09 Jan 2018) 1964. The first Ford Mustang was rolling off the assembly line, The Rolling Stones released their debut album, and the S&P 500 Index got off to what would be its best start of any year...until 2018. By Tuesday's close, the S&P had notched its sixth consecutive record of the young year, out of six trading days. Banks and health care companies led Tuesday's rally, but virtually every sector and market cap joined in. Hopes are high for the upcoming earnings season, and corporations are celebrating the potential benefits to their balance sheets as tax reform kicks in. The biggest threat to the rally, in our opinion, continues to be geopolitical concerns. For the time being, however, friction on the Korean Peninsula appears to be easing as we move closer to the Summer Olympics in Pyeongchang, South Korea. To be sure, this relative calm will not be maintained. The only question is the timing. Investors should use this lull in the action to add further protection on their investment portfolio. Penn Wealth Management clients and Penn Wealth Publishing members should take this time to revisit the "Protecting Your Portfolio" article in last month's Penn Wealth Report.
(09 Jan 2018) 1964. The first Ford Mustang was rolling off the assembly line, The Rolling Stones released their debut album, and the S&P 500 Index got off to what would be its best start of any year...until 2018. By Tuesday's close, the S&P had notched its sixth consecutive record of the young year, out of six trading days. Banks and health care companies led Tuesday's rally, but virtually every sector and market cap joined in. Hopes are high for the upcoming earnings season, and corporations are celebrating the potential benefits to their balance sheets as tax reform kicks in. The biggest threat to the rally, in our opinion, continues to be geopolitical concerns. For the time being, however, friction on the Korean Peninsula appears to be easing as we move closer to the Summer Olympics in Pyeongchang, South Korea. To be sure, this relative calm will not be maintained. The only question is the timing. Investors should use this lull in the action to add further protection on their investment portfolio. Penn Wealth Management clients and Penn Wealth Publishing members should take this time to revisit the "Protecting Your Portfolio" article in last month's Penn Wealth Report.
Dow hits 25,000 for the first time, but here's a really amazing stat
(04 Jan 2018) Shortly after Thursday's open, the Dow notched an impressive record: it hit 25,000 for the first time ever. Pretty remarkable, considering the dire predictions we were virtually guaranteed would transpire back in November, 2016. But here's an even more impressive fact: the S&P 500 has recorded gains for every single calendar month since November of 2016. Every single month in 2017, positive. The last time anything like that happened (using the S&P 500 and its predecessor indices as the benchmark) was 1927. Ninety years ago. Now that's impressive.
(04 Jan 2018) Shortly after Thursday's open, the Dow notched an impressive record: it hit 25,000 for the first time ever. Pretty remarkable, considering the dire predictions we were virtually guaranteed would transpire back in November, 2016. But here's an even more impressive fact: the S&P 500 has recorded gains for every single calendar month since November of 2016. Every single month in 2017, positive. The last time anything like that happened (using the S&P 500 and its predecessor indices as the benchmark) was 1927. Ninety years ago. Now that's impressive.
Another catalyst for the US stock market: foreign investors
(04 Dec 2017) The Wall Street Journal reported that foreign investment is flooding into the US stock market at the highest clip in years. Furthermore, considering total foreign ownership of US stocks amounts to just 14%, there is plenty of room to grow. Interestingly, this massive inflow of cash is happening at a time when the global economy is improving. The US market tends to be a defensive holding for foreign investors when other areas of the globe are facing economic troubles. Perhaps others are taking notice of America's two straight quarters of 3%+ economic growth.
(04 Dec 2017) The Wall Street Journal reported that foreign investment is flooding into the US stock market at the highest clip in years. Furthermore, considering total foreign ownership of US stocks amounts to just 14%, there is plenty of room to grow. Interestingly, this massive inflow of cash is happening at a time when the global economy is improving. The US market tends to be a defensive holding for foreign investors when other areas of the globe are facing economic troubles. Perhaps others are taking notice of America's two straight quarters of 3%+ economic growth.
Black Monday...thirty years later
(19 Oct 2017) I remember exactly what I was doing when I first heard the news—walking out of the chow hall at Davis-Monthan AFB in Tucson. The Dow Jones Industrial Average had just closed for trading, after shedding 22.6% of its value. Want to get an idea what that would look like today? The Dow, at today's value, would have to plunge 5,235 points in a single session. It seems unfathomable; but, then again, it did back in 1987 as well. When the markets opened today, it appeared as if there would be some giveback in sympathy to that infamous trading day, as the Dow shed 104 points out of the gate. But, six and a half hours and several earnings reports later, the index had clawed back every one of those points, and five more for good measure. No, this is not 1987. Earnings reports this quarter will continue to be rosy, and the economy is strong. That being said, any number of geopolitical or even domestic issues could cause a panic. Investors must understand their risk tolerance and be appropriately allocated (which, we are sad to say, is generally not the case for the average investor).
(19 Oct 2017) I remember exactly what I was doing when I first heard the news—walking out of the chow hall at Davis-Monthan AFB in Tucson. The Dow Jones Industrial Average had just closed for trading, after shedding 22.6% of its value. Want to get an idea what that would look like today? The Dow, at today's value, would have to plunge 5,235 points in a single session. It seems unfathomable; but, then again, it did back in 1987 as well. When the markets opened today, it appeared as if there would be some giveback in sympathy to that infamous trading day, as the Dow shed 104 points out of the gate. But, six and a half hours and several earnings reports later, the index had clawed back every one of those points, and five more for good measure. No, this is not 1987. Earnings reports this quarter will continue to be rosy, and the economy is strong. That being said, any number of geopolitical or even domestic issues could cause a panic. Investors must understand their risk tolerance and be appropriately allocated (which, we are sad to say, is generally not the case for the average investor).
Investors are finally letting politics get in their head; thanks CNBC
(18 Aug 2017) If we wanted to hear wall-to-wall politics incessantly throughout the day, we have a number of choices on TV, depending upon our political leanings. If we want businessnews, however, we should be able to tune into the business network, CNBC, and get away from politics. For five straight days, from six in the morning until five in the afternoon, CNBC has been all politics, all the time. On Thursday, they finally worked their magic and got into investors’ heads, driving the market down over 200 points. There is one, and only one, salient point which the network brought up, and that revolves around President Trump’s key economic advisor, Gary Cohn. If he ends up quitting the team, expect a big market hit. If the GOP does not get tax reform done this year, expect a 5-10% correction. Other than those two issues, simply tune out of the faux business channel altogether. For the record, despite Thursday’s horrendous close, the S&P and the Dow finished the week down just 0.65% and 0.66%, respectively.
(18 Aug 2017) If we wanted to hear wall-to-wall politics incessantly throughout the day, we have a number of choices on TV, depending upon our political leanings. If we want businessnews, however, we should be able to tune into the business network, CNBC, and get away from politics. For five straight days, from six in the morning until five in the afternoon, CNBC has been all politics, all the time. On Thursday, they finally worked their magic and got into investors’ heads, driving the market down over 200 points. There is one, and only one, salient point which the network brought up, and that revolves around President Trump’s key economic advisor, Gary Cohn. If he ends up quitting the team, expect a big market hit. If the GOP does not get tax reform done this year, expect a 5-10% correction. Other than those two issues, simply tune out of the faux business channel altogether. For the record, despite Thursday’s horrendous close, the S&P and the Dow finished the week down just 0.65% and 0.66%, respectively.
(21 Jul 2017) The chronically-strong stock market is finally chasing away the short sellers.
It's like those punks sitting at the back corner of the craps table, putting their chips on "don't come" and "don't pass" while you are in the middle of a hot set of rolls. you just want to throw your gin and tonic at their heads. You laugh at their misery with each successful drop of the dice. A similar scenario is playing out right now in the markets. This week the S&P hit yet another record high. For six months, the short-selling naysayers have taken it on the chin, and they are starting to feel the pain. Bets against SPY, the benchmark tracking ETF of the S&P 500, fell to $39 billion last week—the lowest level since May of 2013. Good riddance. These people remind me of the 96-year-old man whose epitaph read "I told you I was sick!"
It's like those punks sitting at the back corner of the craps table, putting their chips on "don't come" and "don't pass" while you are in the middle of a hot set of rolls. you just want to throw your gin and tonic at their heads. You laugh at their misery with each successful drop of the dice. A similar scenario is playing out right now in the markets. This week the S&P hit yet another record high. For six months, the short-selling naysayers have taken it on the chin, and they are starting to feel the pain. Bets against SPY, the benchmark tracking ETF of the S&P 500, fell to $39 billion last week—the lowest level since May of 2013. Good riddance. These people remind me of the 96-year-old man whose epitaph read "I told you I was sick!"
(19 Jun 2017) Market continues its climb as tech stocks bounce back. Sell in May and do what, now? The Dow Jones and the S&P 500 both hit new record highs on Monday, with tech stocks posting their strongest gain of the year. There goes CNBC's narrative of the sector falling off a cliff after a rough few weeks. The NASDAQ composite, filled to the brim with tech stocks, surged 1.4% on the day. Uh oh...back to the Russia—Trump collusion narrative, kids.
(25 Apr 2017) Nasdaq hits 6,000 for the first time. The NASDAQ Composite launched in 1971 with 50 companies and a value of 100. Today, 46 years later, the technology-laden index hit 6,000 for the first time in its history. Since the election, the composite index is up 15.7%.
(02 Apr 2017) All major indexes notch very solid first quarter. No matter what happens from here on out (we see more growth, by the way), the first quarter is in the books—and what a solid one it was. The index we watch most closely, the S&P 500, jumped 5.53% between 01 Jan and 31 Mar. The 30 stocks making up the Dow Jones Industrial Average rose, on average, 4.56%. The tech-laden NASDAQ made the most impressive run for Q1, up 9.82%. On to Q2!
(27 Feb 2017) $3 trillion added to US economic wealth since election. Since the 2016 general election (about 100 days), companies in the wide-ranging Wilshire 5000 have grown an aggregate of $2.939 trillion in value. This index is widely accepted as the definitive benchmark for publicly-traded companies in the US.